Nuclear Risk Watch: which nuclear sites are at risk right now, and why

Civil nuclear facilities are exposed to earthquakes, wildfire, flooding, storms, drought and armed conflict. The data that describes those threats is real, public and updated constantly. The problem is that it is scattered across dozens of agencies and feeds, and nobody continuously correlates it into one picture of which sites are under pressure at any given moment.
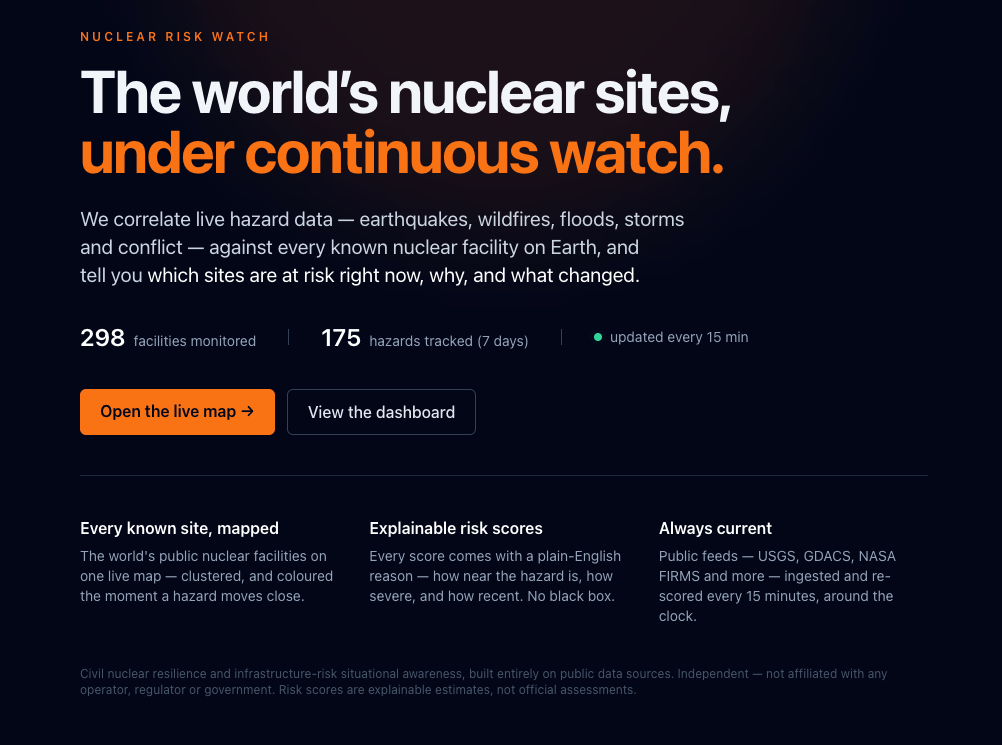
Nuclear Risk Watch does that. It is an independent public platform that monitors the world's known civil nuclear facilities against live natural-hazard and conflict data, and shows which sites are at elevated risk right now, with a plain reason attached to every result. It is live at nuclearwatch.evodefence.uk, free to view, and needs no login.
What it tracks
The map carries 298 known nuclear facilities across 40 countries. Behind it, the platform ingests public hazard feeds and correlates each event against those facility locations by precise geospatial proximity, then re-runs the whole calculation every fifteen minutes, around the clock. So the picture is always current, and changes are tracked over time rather than frozen at one snapshot. At the time of writing it was following 174 active hazards from the previous seven days.
Each facility carries a score from 0 to 100, banded from low through moderate, elevated and high to severe. The score is never a black box. There is always a stated reason behind it.
How the score works
Every score is the product of four interpretable factors, which is what enables it to explain itself.
The first is hazard type, meaning how threatening that class of event is to a nuclear site in the first place. The second is severity, the normalised intensity of the specific event, for example an earthquake magnitude or a fire's radiative power. The third is proximity, because a hazard's influence falls away with distance from the site. The fourth is recency, because influence decays over time, with longer persistence held for sustained threats such as ongoing conflict.
To put that in plain terms, an earthquake nine kilometres from a coastal plant twelve minutes ago, at moderate-to-high severity and almost no distance decay, lands the site at elevated risk. You can read why for yourself without taking anyone's word for it.
Where the data comes from
Every input is public, and the attribution travels with it. Real-time earthquakes come from the USGS Earthquake Hazards Program. Floods, tropical cyclones, droughts and volcanic activity come from GDACS, the joint disaster-alert framework run by the UN's OCHA and the European Commission's Joint Research Centre. Active-fire and thermal detections for wildfire come from NASA FIRMS. Facility locations and metadata come from Wikidata, released to the public domain under CC0. The basemap is OpenStreetMap data, served as OpenFreeMap and OpenMapTiles tiles.
Conflict is the honest caveat. ACLED and UCDP are the authoritative sources I want to draw on, and both are access-gated. GDELT was assessed and excluded, because it proved too noisy to support credible per-site scoring. So conflict context at the moment comes from curated, manually sourced entries rather than a live feed, and the platform is built to swap in the authoritative feeds as access allows. I would rather say that openly than dress up a noisy signal as something firmer than it is.
What it is, and what it deliberately is not
This matters enough to state directly: Nuclear Risk Watch is civil and defensive in scope. It tracks resilience and hazard exposure for facilities that are already publicly documented. It does not deal in military targeting, classified information or hidden sites, and it is not affiliated with any operator, regulator or government.
The risk scores are explainable estimates for situational awareness. They are not official safety assessments, and they are not trying to be. The value is in turning fragmented public data into a clear, current, inspectable answer to a simple question, not in pretending to a regulatory authority it does not have.
How it is built
The front end is Next.js and TypeScript, with mapping handled by MapLibre GL on an OpenFreeMap basemap. The data layer is PostgreSQL with PostGIS doing the geospatial correlation, and background workers re-ingest and re-score every fifteen minutes. Like everything else I build, it is fully self-hosted on independent infrastructure.
Have a look at nuclearwatch.evodefence.uk. The figures move, the reasoning stays visible, and the sources are all there to check.